Commercial Real Estate Comps: Pull Sales Into a Spreadsheet
Updated Nov 17, 2026
Commercial real estate comps are recent sales of buildings like the one you're pricing: the same property type, in the same submarket, sold in about the last one to two years. To pull them into a spreadsheet, give each sale its own row with the same columns, confirm the sold price from a comp database or the county record, and add price per square foot and cap rate so buildings of different sizes compare fairly.
Below is a comp sheet template you can copy. After it comes a short guide to which tool gives you which kind of data, and then the steps that keep a comp set honest.
A commercial comp sheet template to copy
Paste this header row into a blank sheet. Every column is here because a later step uses it.
`` Address | Property type | Submarket | Sale date | Sale price | Building SF | Land acres | Units | Year built | Occupancy at sale | Net operating income | Income basis | Cap rate | Price per SF | Buyer | Seller | Deal notes | Price source | Verified? ``
Most of these columns explain themselves. These are the ones people fill in wrong:
| Column | What goes in it | Why it matters |
|---|---|---|
| Property type | Industrial, retail, office, multifamily, land | A warehouse and a strip center at the same price per square foot aren't comparable. Filter on this first. |
| Sale date | The recording date, not the listing date | A sale from before interest rates moved can mislead you. |
| Sale price | The recorded or confirmed price, never the asking price | Listing sites mostly show asking prices. Only closed sales are comps. |
| Building SF / Units | Gross building area, or unit count for apartments | You divide by this to get price per SF or price per unit. |
| Net operating income | Rent and other income minus operating costs, before loan payments | You need it to work out the cap rate. |
| Income basis | "Actual" or "projected" | Mixing the two is the most common reason cap rates look off. |
| Deal notes | Portfolio sale, sale-leaseback, assumed loan, distressed | These sales skew your range. Flag them, don't delete them. |
| Price source / Verified? | A link or record number, plus yes or no | It tells you which numbers you can defend when a lender asks. |
If you're new to comps in general, our guide to what comps are in real estate covers the basics for homes. Commercial comps are harder: prices are less public, and income matters more than bedrooms.
Where to get commercial real estate comps: which tool for which data
No single free source has every commercial sale with its price, so the right tool depends on which column you're trying to fill. Here's how the main options split up:
| Source | Good for | Weak spot |
|---|---|---|
| Paid comp databases (Crexi Intelligence, Reonomy, PropertyShark) | Sold prices, plus broker-reported income and occupancy you can't easily find elsewhere. Crexi says its database covers over 46 million sales comps, both broker-reported and county-verified. | Paid. Coverage is thinner for small or off-market deals. |
| County recorder and assessor | Who sold to whom, when, and in many states the price or the transfer tax that reveals it | One county at a time. No income data. |
| Your local MLS commercial search, if you're a member | Sales that brokers in your area reported | Many commercial deals never go through the MLS. |
| Listing sites and broker market reports | Finding which properties traded recently | Prices shown are usually asking, not sold. |
| Open-web research into a sheet (where Autofill fits) | Building the first list of candidate sales and filling public facts fast | Can't reach data that sits behind a login. |
If you price deals every week and need income figures on every row, a paid comp database is worth the cost. If you need a solid first comp set for one deal, or you want to keep a list fresh without redoing it, public records plus web research go a long way.
How to pull the comps into your sheet, step by step
The work comes down to five steps: set your limits, find candidate sales, confirm each price, normalize the numbers, then read the set as a whole.
1. Set your limits before you search
Write down the subject property's type, size range and submarket, plus a time window. Twelve to 24 months is a common place to start. If you can't find enough sales, widen one thing at a time and note it in the sheet. Older sales or a bigger radius are both fine. Widening everything at once without saying so is not. A comp set is only as strong as the reasons you can give for each row.
2. Find candidate sales
Start wide, because you'll drop rows later. Pull recent trades from a comp database or a broker report. Then check the county record for each one. Crexi's own guide points to tax records as the way to confirm sales history and ownership. Put every candidate in the sheet now, even ones you doubt, and leave the price blank until step 3.
3. Confirm the sold price
This is the slow part, and where most free research stalls. In California, county recorders don't keep the sale price, but you can work it out from the tax on the deed. Sutter County's recorder explains that the documentary transfer tax is $0.55 per $500 of value, which is $1.10 per $1,000. That's why Berkeley's records tutorial says to divide the county tax by 1.1 and multiply by 1,000.
An illustration: a deed showing $3,300 in county transfer tax points to a price of about $3 million. There's a catch. The tax isn't charged on a loan the buyer takes over, so a deal with an assumed loan can look cheaper than it was. Note it in Deal notes.
Some states don't make sale prices public at all. HomeLight counts 12 non-disclosure states, including Texas, Utah, Idaho and Kansas. There, your price column has to come from brokers, comp databases or the people in the deal. Expect some blank cells, and leave them blank rather than guessing.
4. Normalize so the rows compare
Add price per SF (sale price ÷ building SF) for industrial, retail and office. For apartments, use price per unit. Then add cap rate, which is net operating income ÷ sale price. PropertyMetrics gives a simple example: $140,000 of net operating income on a $2 million price is a 7% cap rate.
Watch the Income basis column here. A broker's projected income on one row and actual in-place income on the next can put two similar buildings a full point apart in cap rate, just because the income was measured differently.
5. Read the set, not the average
Sort by sale date, then by price per SF, and look at the rows you flagged. A portfolio sale gets a bulk price. A sale-leaseback is priced around the tenant's lease. Neither is a clean market price. Keep them in the sheet for context, but leave them out of the range you quote.
Mistakes that ruin a comp sheet
Almost every bad comp sheet fails in one of four ways, and each one is easy to avoid if you catch it early.
- Asking prices in the sale price column. If a price came from a listing, it goes in a separate column until a second source confirms the close.
- No source per row. Three months later, nobody remembers whether a price came from a deed or a guess. The Price source column takes seconds to fill and saves the whole sheet.
- Mixing property types to pad the count. Five good comps beat twelve stretched ones.
- Building the sheet once. Markets move. A comp set that never gets new sales goes stale fast.
Doing this in Autofill
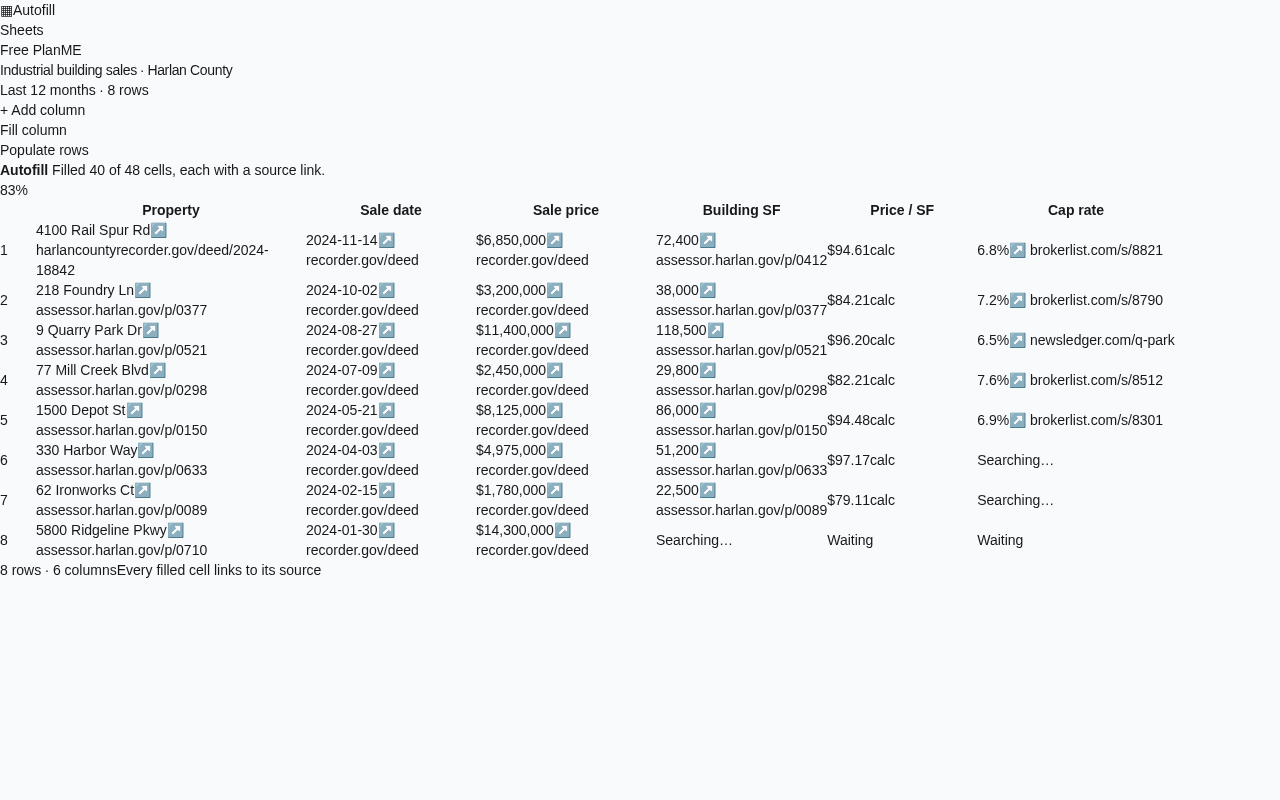
Autofill builds the comp sheet and does the first round of research for you. You describe the list in one sentence, such as "Industrial buildings over 20,000 square feet sold in this county in the last 18 months, with sale price, building size, cap rate and buyer." It proposes the columns, can find the rows themselves, and then searches the web to fill each cell, keeping a source link behind every filled cell so you can check it. You can set a sheet to refresh so new sales land on their own, stop a fill that's going the wrong way, and download the sheet as CSV or Excel for your underwriting model. If you haven't built a table from a prompt before, here's how an AI table generator fills a sheet with real data.
Here's where it stops. Autofill doesn't log into an MLS, CoStar or Crexi. It works from what's published on the open web. In non-disclosure states, or for off-market deals, some price cells will stay empty, and a paid comp database or a broker is the better way to fill those. It's a fast way to build a first comp set and keep it current. It doesn't replace an appraisal, so check any number you'll take to a lender.

Questions
Is there a Zillow for commercial property?
Not really, because commercial sale prices aren't gathered into one free public feed the way most home sales are. Crexi comes close: it's a listing marketplace, and its paid Crexi Intelligence product adds sales comps, which it says number over 46 million. Most free browsing still shows asking prices, not sold prices.
How do I find out how much a commercial property sold for?
Start with the county recorder or assessor for the deed and any transfer tax. In states like California you can work out the price from that tax. In non-disclosure states like Texas, a comp database or the listing broker is usually the only way to get the number.
What's the difference between sales comps and lease comps?
Sales comps track what similar buildings sold for. Lease comps track the rent tenants pay for similar space. Use sales comps to price a building, and lease comps to check the rent behind its net operating income.